Today’s post is based on a question I received on my YouTube channel. I want to show you how to
- Create multiple graphical views in an analysis
- Naming the graphical view
- Switch between the different graphical views in the analysis
If you have not checked out the OTBI tutorial video on YouTube, please do. Check out the Part 9 of the tutorial series to understand how to create different views. Make sure to subscribe for more content on Oracle Cloud ERP and EPM.
Create Analysis
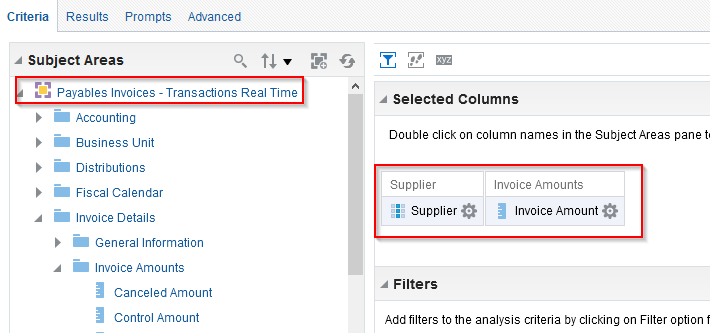
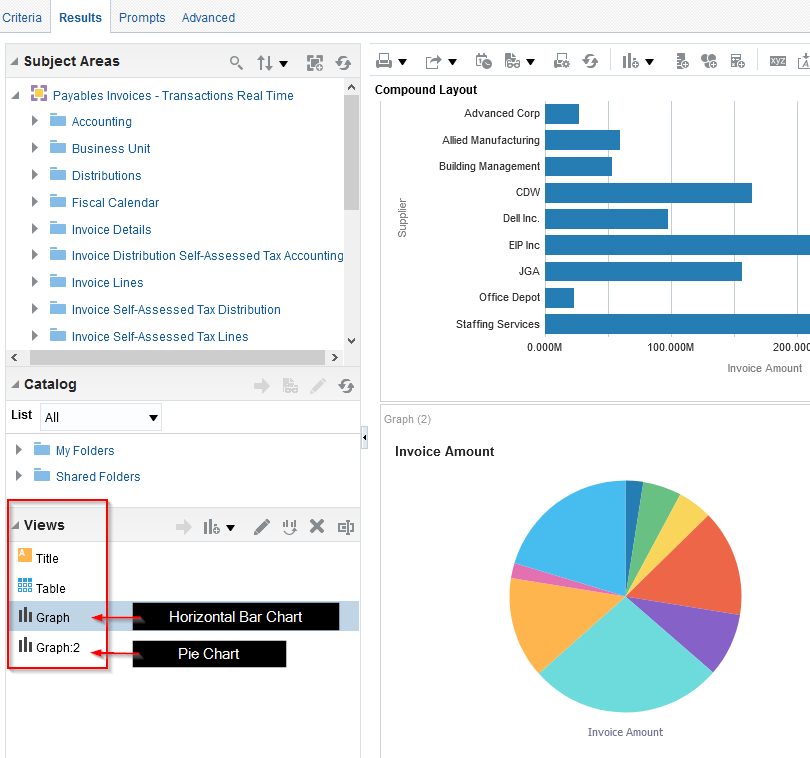
I will be using the “Payables Invoices – Transactions Real Time” subject area. I will be using the “Supplier” and “Invoice Amount” fields to create my visualizations.
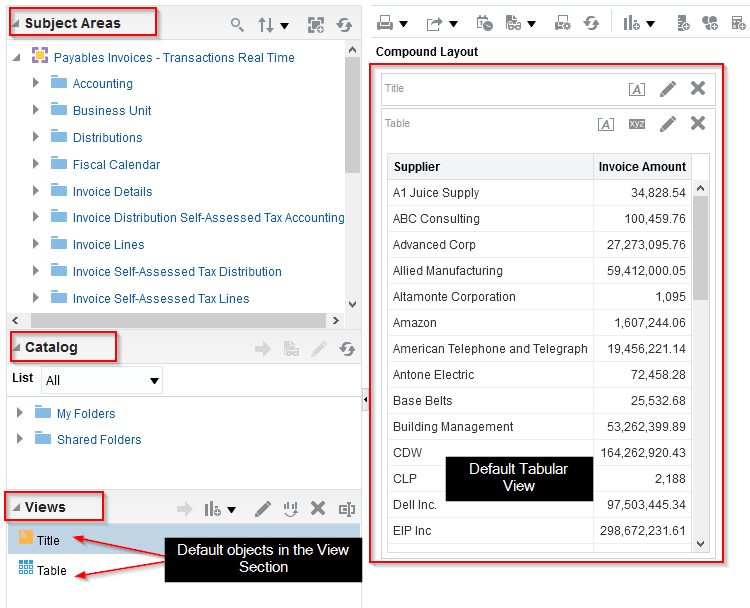
Click on the Results Tab to view the results and make sure you are able to view the data. By default, you should see a tabular view. On the left pane, you should see three different sections – Subject Areas, Catalog, Views. On the views section you should see two default objects – Title and Table.
Add Graphical Views
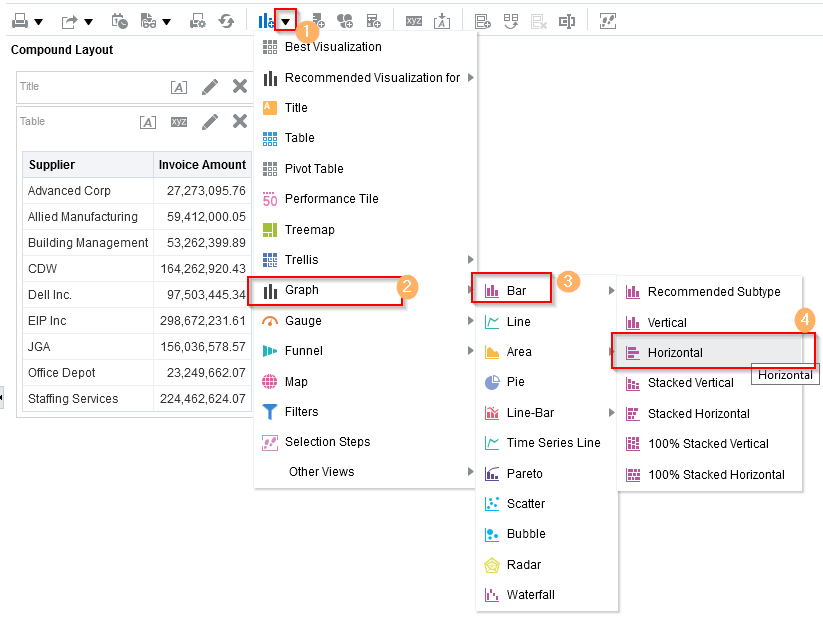
Add a horizontal bar chart
- Click on New View
- Hover your cursor over Graph from the options
- Hover your cursor over Bar from the options
- Click on Horizontal
This will add a new horizontal bar graph to the analysis.
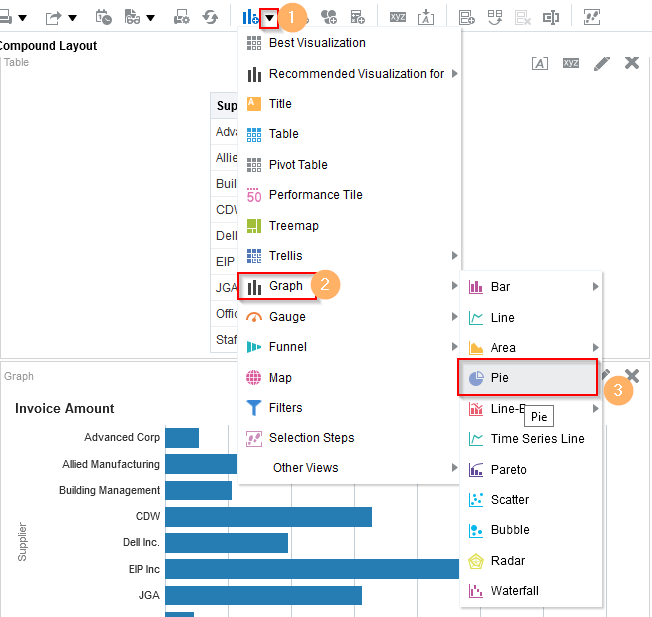
Add a Pie Chart
- Click on New View
- Hover your cursor over Graph from the options
- Click on Pie
This will add a new pie chart to the analysis.
You should now have 3 different views in your analysis – Table, Horizontal Bar chart and Pie Chart.
Rename the Views
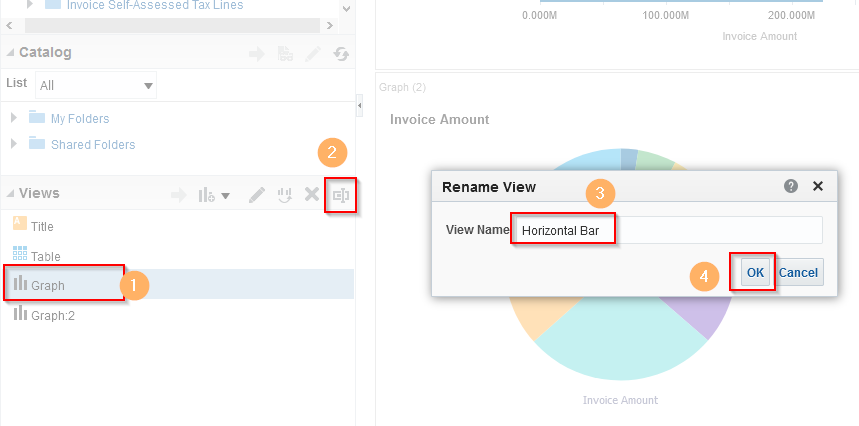
The next steps is to rename the graphical views we added. Check the “Views” section in the left pane. You should see 4 objects – Title, Table, Graph and Graph:2. Graph represents the Horizontal Bar chart we created and Graph:2 represents the pie chart we created.
Lets rename Graph to Horizontal Bar and Graph:2 to Pie Chart. In the Views section, click on “Graph” and then click on the rename icon. Provide view name as “Horizontal Bar” and then click OK.
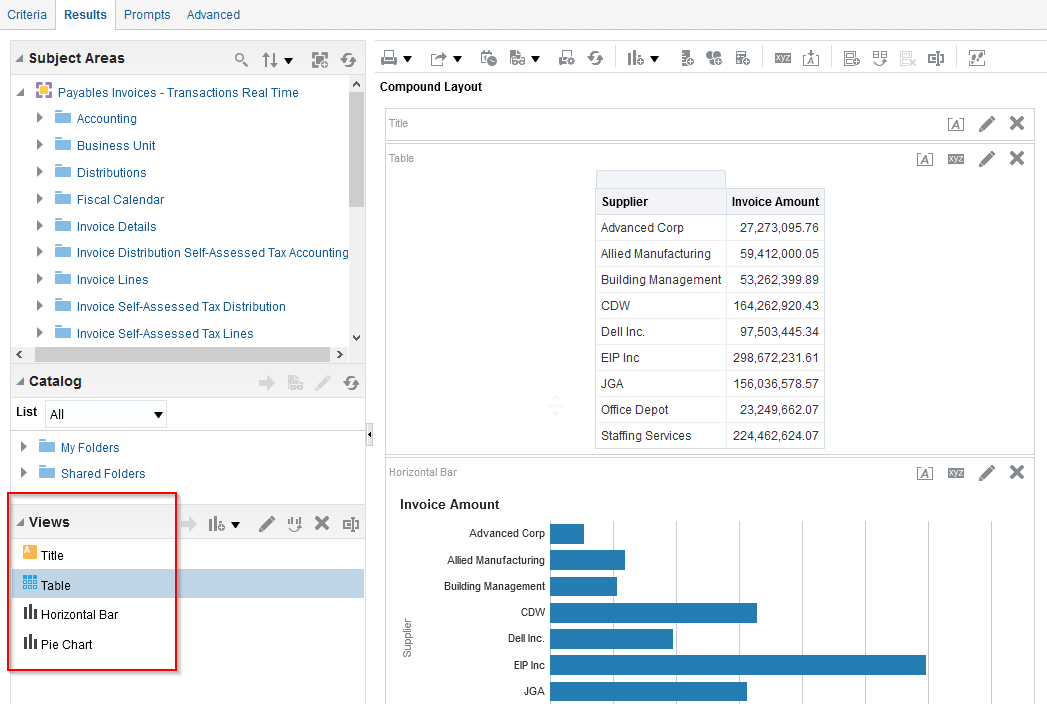
Repeat the same steps for Graph:2. Provide View Name as “Pie Chart” and click OK. You should now have the following objects in the Views Section – Title, Table, Horizontal Bar and Pie Chart.
Configuring View Selector
Let’s remove the Table view from the analysis by deleting it.
- Click the “Delete” icon for the Table view in the Compound Layout
- Select the Table object in the “Views” section and click on delete (preferred)
Add View Selector
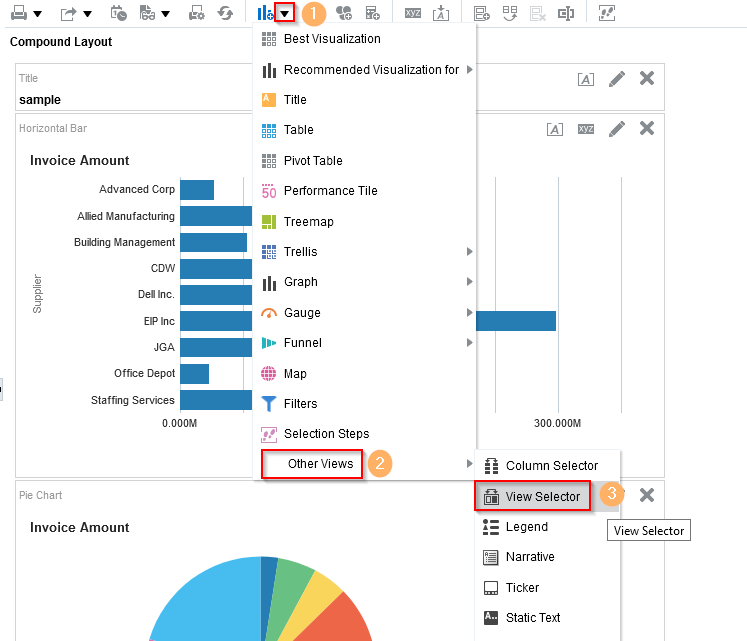
- Click on New View
- Hover your cursor over Other Views from the options
- Click on View Selector
- Click and move the View selector to the top of the Horizontal Bar Chart
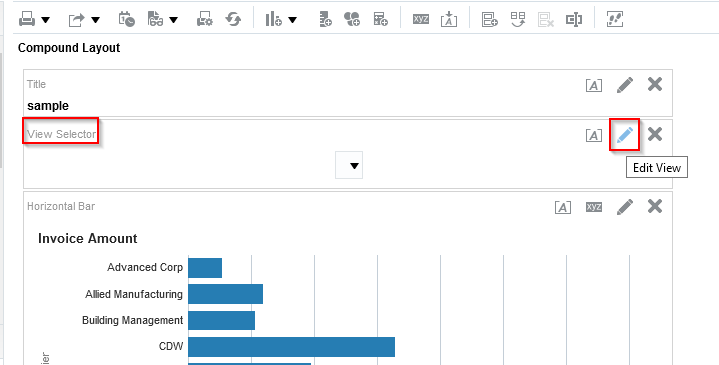
Edit View Selector
Click on “Edit View” for the view selector view.
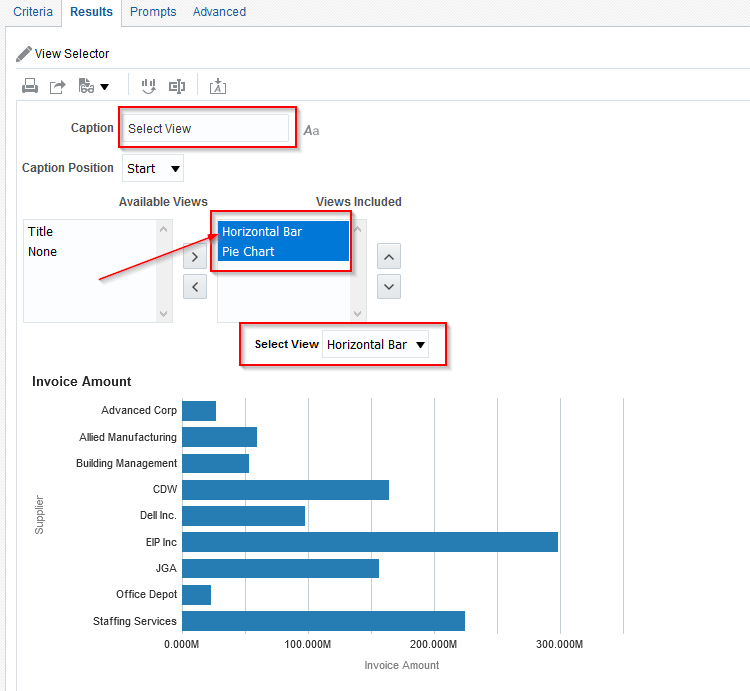
Perform the following steps in the Edit View selector window:
- Give a caption
- Click and Move Horizontal Bar chart to the Views Included section
- Click and move the Pie chart to the Views Included section
- Click on “Done” button
Remove The Views from Compound Layout
Back in the compound layout, delete the Horizontal Bar and Pie Chart views.
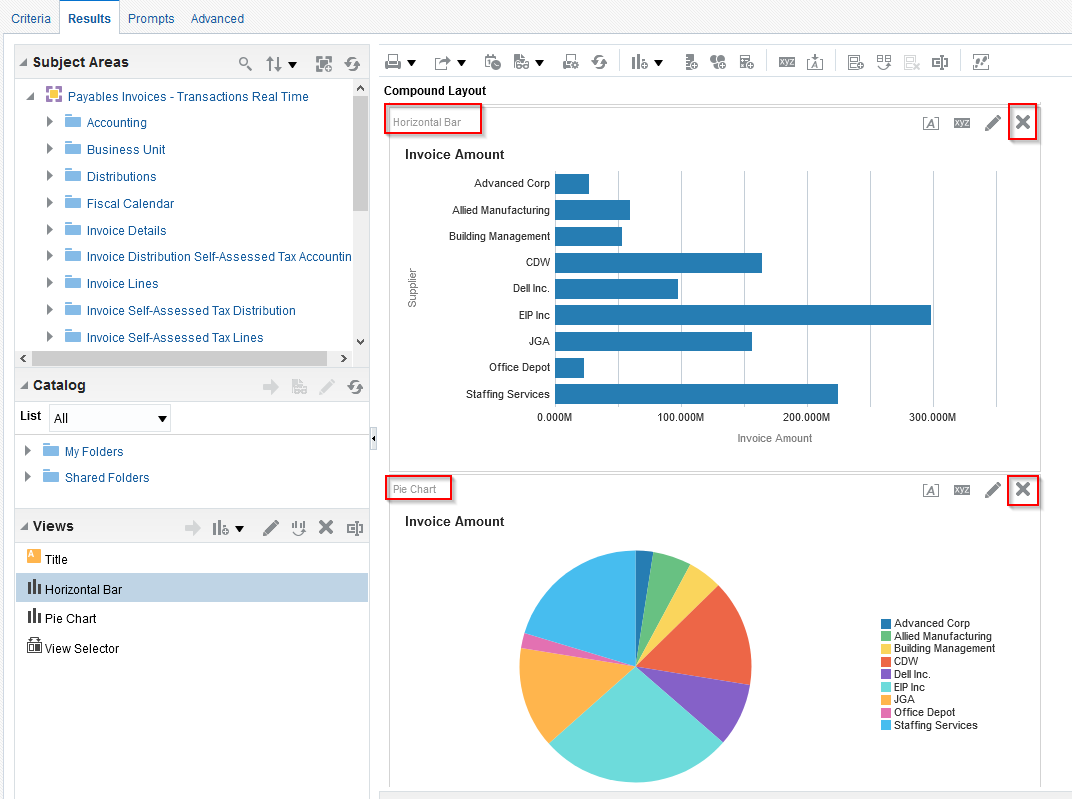
Make sure to not delete the objects from the Views section.
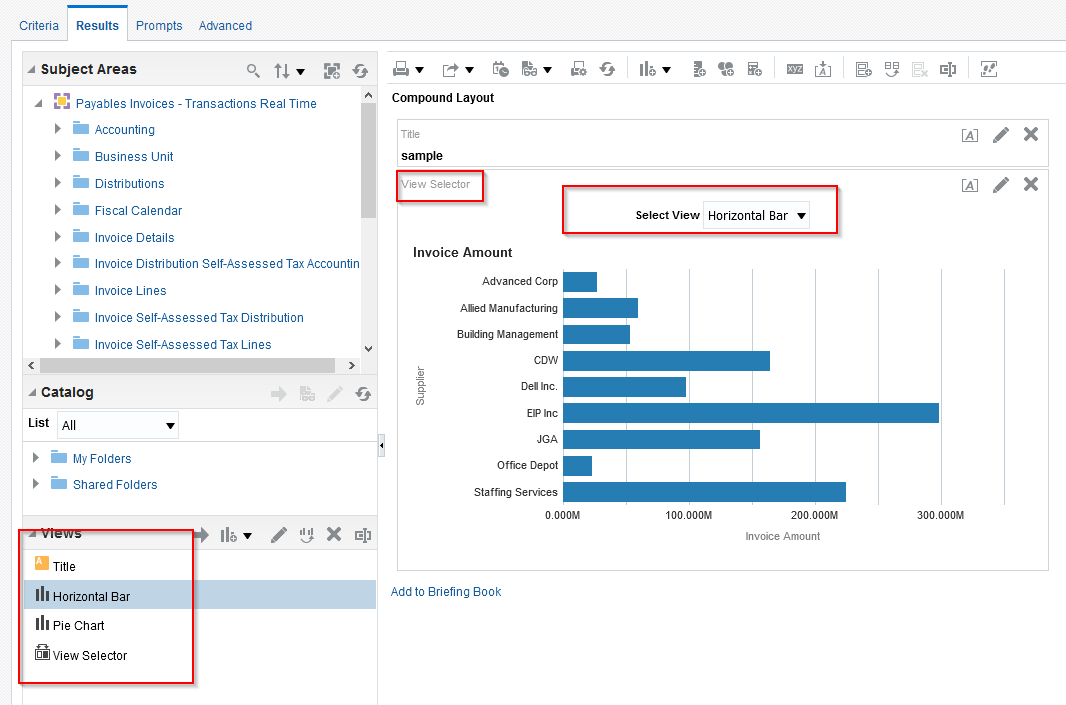
You should now have the view selector view. Save the analysis and you are good to go with this analysis.
I appreciate you taking the time to read this. I will be happy to hear your feedback. Please consider subscribing to the YouTube channel here. I have also started a podcast on Oracle ERP, HCM, EPM and analytics. It would be great if you could listen and provide your feedback and suggestions. Happy experimenting.