Today let us take a look at the basics on developing a new BI Report in Oracle Cloud. We will be creating a new custom report.
Pre-Requisites for Developing the BI Report
Before we start creating a bi report in Oracle Cloud, make sure you have access to
- Oracle Cloud Environment
- BI Developer Role
You can login directly to the BI server using https://<domain_name>.oraclecloud.com/analytics
BI Report Development
There are various steps involved in creating a custom bi report. For our development purpose, we will have to create the following:
- Data Model
- Report Layout
Data Model
A data model consists of data elements (columns) and will be used to display data on the report output. Data elements can be:
- Columns from Data base tables
- Expressions / Formulas created from the data base columns
- Parameters
In this post, we will create a simple report without any parameters or expressions. I will be using the below SQL to create the data model
[sql]
SELECT period_name, period_year, period_num
FROM gl_periods;
[/sql]
Now lets see how we can create the data model.
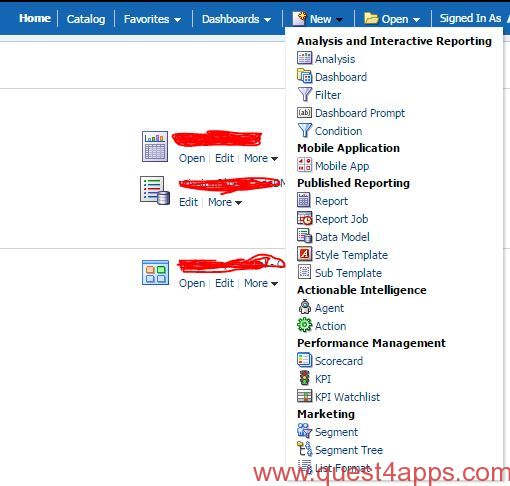
- Login to BI Role and click on “New” and select “Data Model” from the options
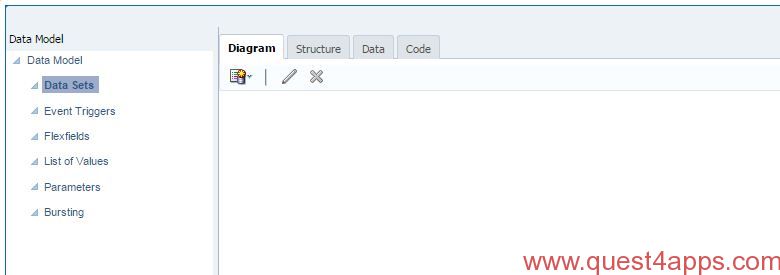
2. This will open the Data Model creator as shown below
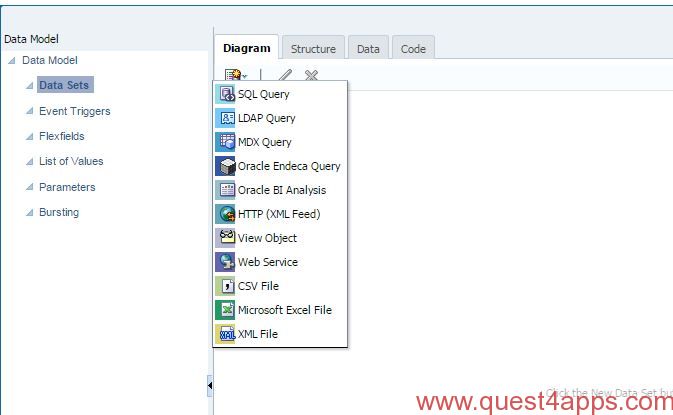
3. Next step is to select the option to create the data model using SQL Query. See the below screen shot. Select “SQL Query” from the available options
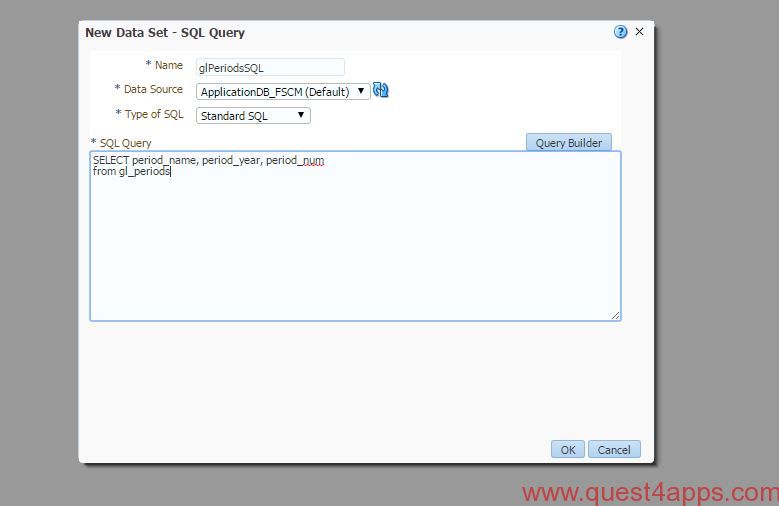
4. You will be able to select the Data Source and enter the SQL Query in the next step. Once you have done those steps, select OK. I have renamed the Name of the Data Set and entered the Query. You may also use the Query Builder to build the SQL Query.
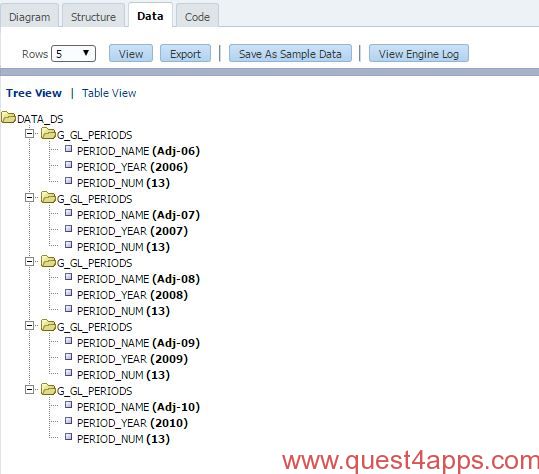
5. Click on the Data Tab in the Data Model Editor. Select number of rows as 5 and click on View. This will execute the query and show the records retrieved in XML Format. You can click on the “Table View” to view the records in Tabular format. Check the below screen shots for more details
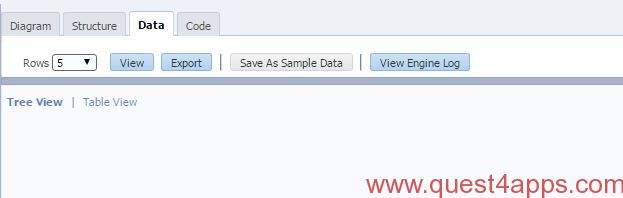

6. Click on “Save as Sample Data“. This step is necessary to create the report / report layout. Save the Data Model.
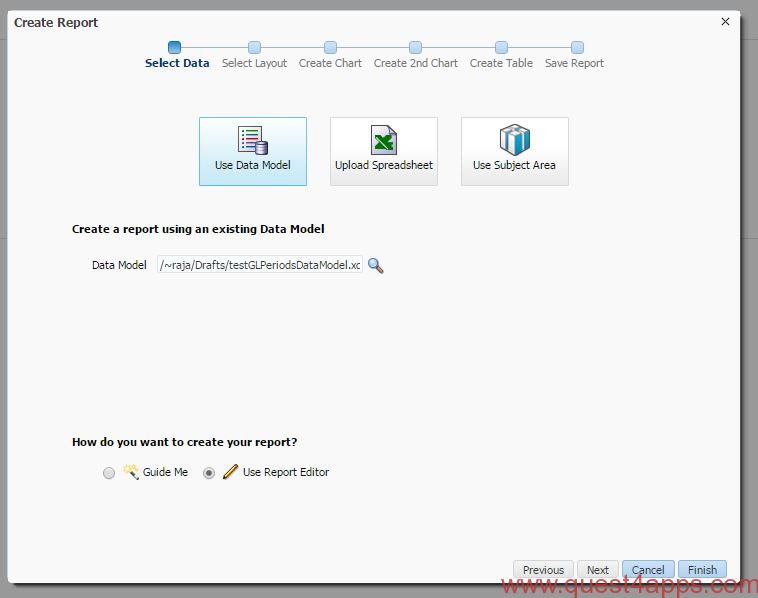
7. Click on “Create Report” and select “Use Report Editor” and click “Finish”. Make sure “Use Data Model” option is highlighted
8. System will prompt you to save the report. Give the report a name and save it. After you save the report, select “Blank (Portrait)” option and click Ok. This will open the Report Editor / Layout Editor. You will be able to create the report layout here.
9. Drag and drop the “Data Table” component from the Insert Tab
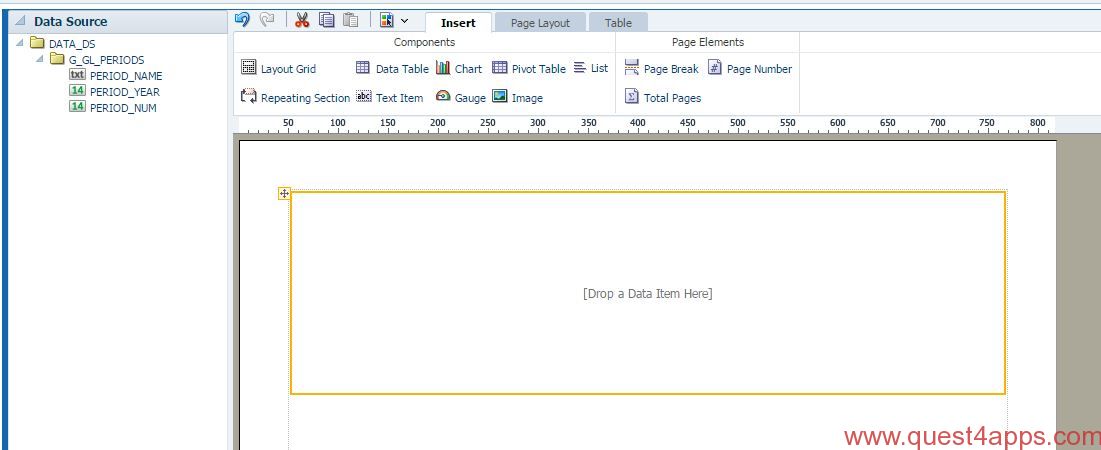
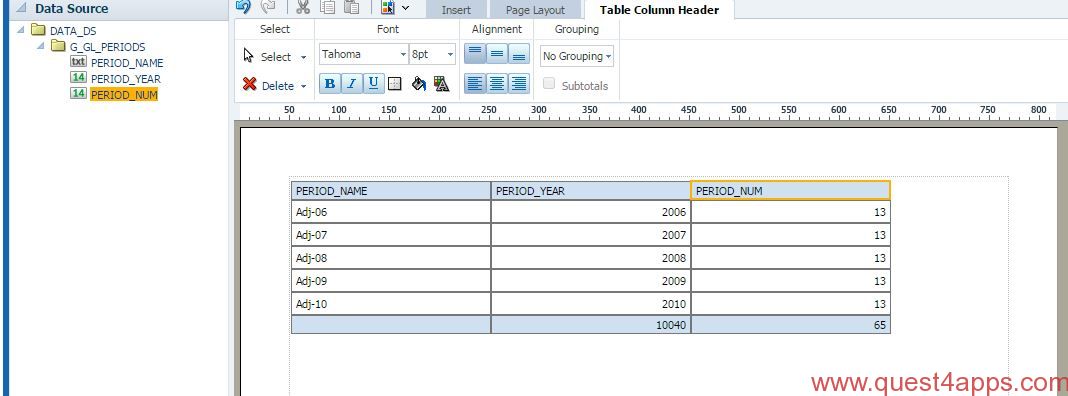
10. Next step is to add the Data Elements / columns in the Data Table that we created in the previous step. Once you are done, the layout will look something like this
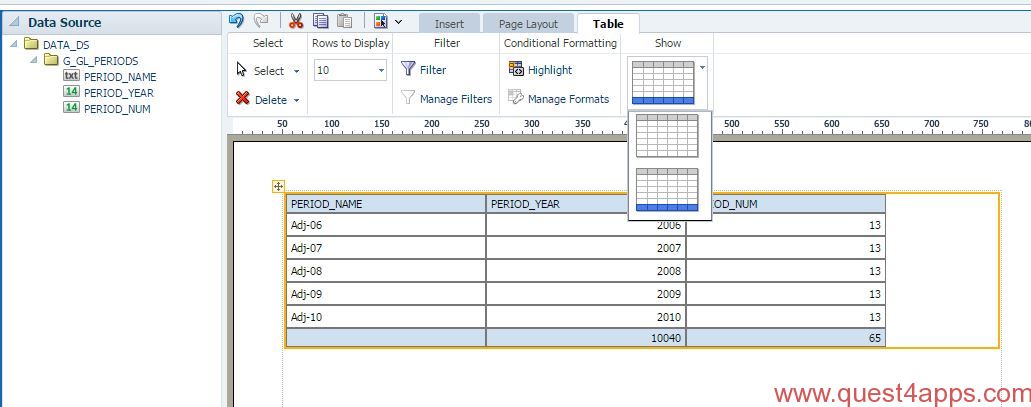
11. Select the Table and you will be able to see the “Table” tab in the editor. Click on “Show” option and select the view that does not have the “Total View”. In our case it will be the second in the list. See below for details. (Do this step if you don’t want totals to be shown at the end of the report).
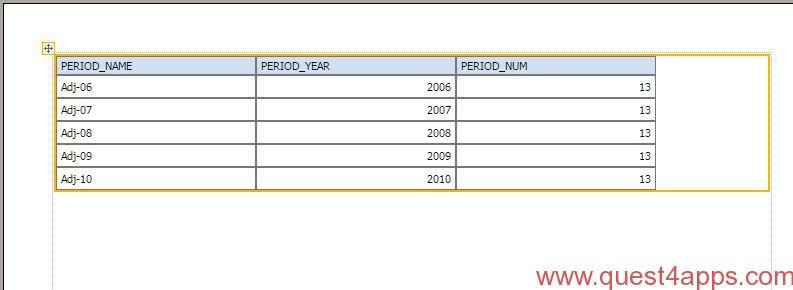
In the above image you can see that the Report Totals has been removed.
12. Click on the Save icon and this will prompt you to give a name for the layout.
13. Click on Catalog and navigate to the folder where you have saved your report.
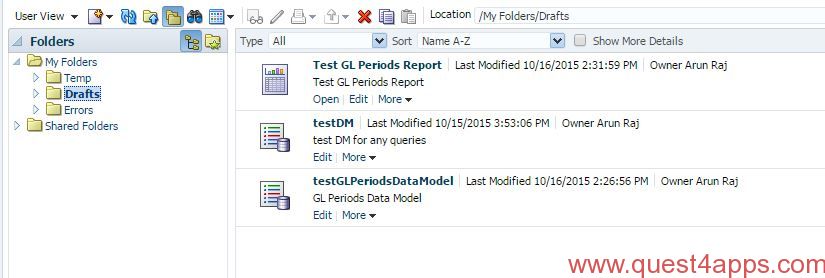
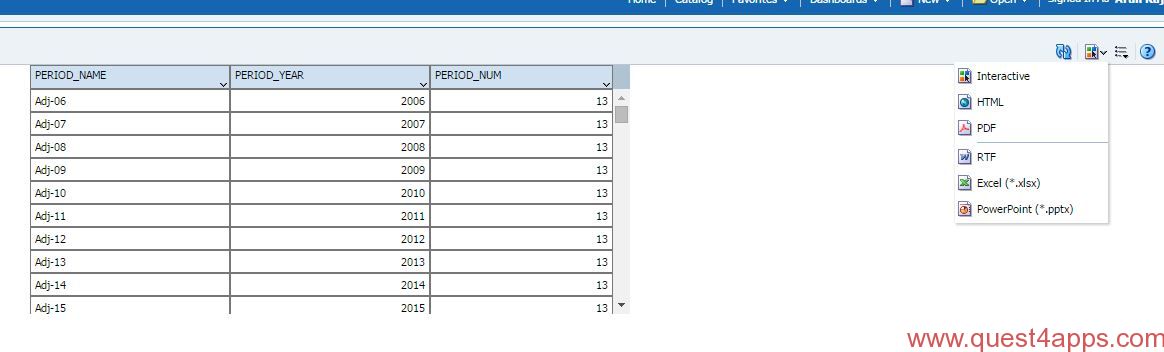
14. Click on Open option below “Test GL Periods Report”. This will open the report and will show you the output.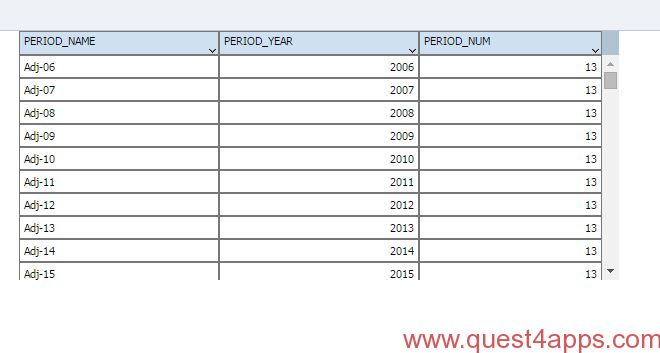
15. You can view the report in various formats. Check the below screen shot for more details.
In this post we had a first look at how we can create a very simple BI Report in Oracle Cloud. In the next few posts, we will take a look at Data Model Properties, List Of Values, Parameters, Layout options etc that can be very helpful in creating complex bi report development.
I hope this post was helpful. Thank you for reading and if you have questions please post them in the comments or email me at arunraj@quest4apps.com.